
Bellabeat Capstone Project
Overview:
This notebook presents my work for the second case study of the Google Data Analytics Professional Certificate focusing on the data analysis process. The data analyst is required to formulate high-level marketing recommendations for Bellabeat, a leading high-tech manufacturer of health-focused products for women including Bellabeat app, Leaf, Time and Spring.
The study covers key steps of data analysis, ask, prepare, process, analyze, share and act. After this data analysis, Bellabeat can refine their marketing strategies to reach their target audience

Ask:
The business task of Bellabeat is to unlock new growth opportunities and to reach the target audience by analyzing fitness data collected from smart devices. This analysis aims to provide valuable insights into consumers' behavior with their smart device usage. My goal is to focus on uncovering trends and discovering the relationship between smart device usage and Bellabeat's customer base and determining how this relationship and trends can impact the company's marketing approach.
The key stakeholders:
. Urška Sršen: Bellabeat’s co-founder and Chief Creative Officer.
. Sando Mur: Mathematician and Bellabeat’s co-founder.
. Bellabeat marketing analytics team: A team of data analysts responsible for collecting, analyzing, and reporting data that helps guide Bellabeat’s marketing strategy.
Prepare:
Data source:
The datasets were collected through a distributed survey conducted by Amazon Mechanical Turk. The Fitbit Fitness Tracker Data is a public domain dataset made by Mobius under a CCO database protection license. These datasets provide 18 .csv data files of a total of thirty Fitbit users’ personal tracker data including second-level, minute-level, hour-level, and day-level information on various metrics such as heart rate, burnt calories, activity intensities, MET, steps, and sleep activity.
Data Assessment:
Reliability: LOW - dataset conducted by 30 individuals. This is a very small sample size to analyze and make recommendations for the required business task.
Originality: LOW - third-party data collected using Amazon Mechanical Turk.
Comprehensive: MEDIUM - the datasets comprise various fields including daily activity intensity, calories, daily step count, sleep duration, and weight records.
Current: LOW - The datasets are 9 years old, which is not relevant anymore because people's habits change over time.
Cited: HIGH - The third-party dataset was available by Mobius via Kaggle.
Data Selection:
dailyActivity_merged.csv
dailyCalories_merged.csv
dailyIntensities_merged.csv
dailySteps_merged.csv
heartrate_seconds_merged.csv
sleepDay_merged.csv
weightLogInfo_merged.csv
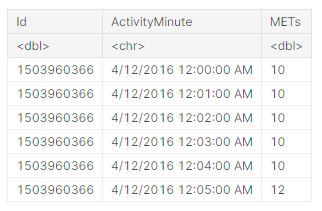
minuteMETsNarrow_merged.csv
Process:
At this stage, we start off with checking data frames to identify commonality.


Analyze:
The result after running summaries:
daily_activity reports 940 cases.
daily_sleep reports 413 cases.
weight_log_info reports 67 cases.
Result after identifying the unique number of users:
daily_activity reports 33 IDs, this means there are more IDs than anticipated.
sleep_day reports 24 IDs, this means 6 users' information was missing.
weight_log_info reports 8 IDs, which means 22 user information was missing.
The result after calculating the average sleep time and the average time in bed:
The average time in bed reports 459 minutes.
The average sleep time reports 419 minutes.
Conclusion: The selected users tend to stay up 40 minutes before falling asleep.
The result after calculating the mean steps and calories burnt:
mean_steps reports 7637.911 steps mean_calories reports 2303.61 calories
Share:

The bar chart above illustrates that more track records were counted on Tuesday, Wednesday, and Thursday throughout the week.

The visualization above illustrates a positive correlation initially but then turned negative - the less burnt calories as non-sedentary increased.
The visualization above illustrates a positive correlation - the more burnt calories as non-sedentary increased.


The visualization illustrates a positive correlation between total steps and calories burnt.

The visualization above shows an inverse relationship between total steps and sedentary minutes at any given time.

The visualization above illustrates a positive relationship between very active minutes and calories burnt
Act:
Conclusion:
The data analysis results indicate a distinct pattern between individuals with non-sedentary lifestyles and positive health outcomes. Keys relationships emerged from the analysis are:
The increased minutes of very active activity positively impact with higher calories burnt.
Active individuals exhibit a positive association with better sleep quality.
Individuals with sedentary lifestyles project less calories burnt throughout the day.
Recommendation:
Redesign the Bellabeat app so it can monitor heart rate which assists consumers understand their exercise efficiency by taking ti account their unique characteristics such as BMI, work rate, and lifestyle.
Improve the sleep tracker to offer valuable insights into users' sleep patterns. It should provide comprehensive analysis such as providing duration spent in deep sleep, periods of restlessness, and overall sleeping time.
Include a function in the Bellabeat app to notify users who have a higher number of sedentary minutes.